新書推薦:
《
中国王朝内争实录:宠位厮杀
》
售價:HK$
63.3
《
凡事发生皆有利于我(这是一本读了之后会让人运气变好的书”治愈无数读者的心理自助经典)
》
售價:HK$
45.8
《
未来特工局
》
售價:HK$
57.3
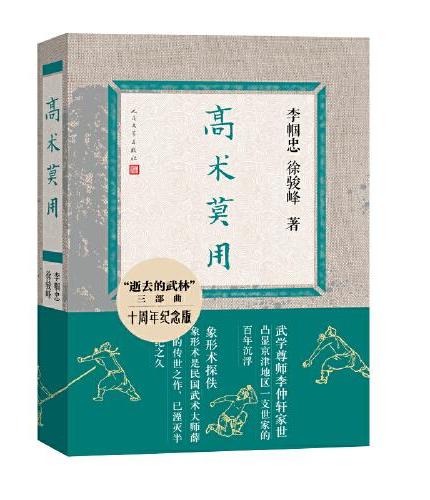
《
高术莫用(十周年纪念版 逝去的武林续篇 薛颠传世之作 武学尊师李仲轩家世 凸显京津地区一支世家的百年沉浮)
》
售價:HK$
56.4
《
英国简史(刘金源教授作品)
》
售價:HK$
101.2
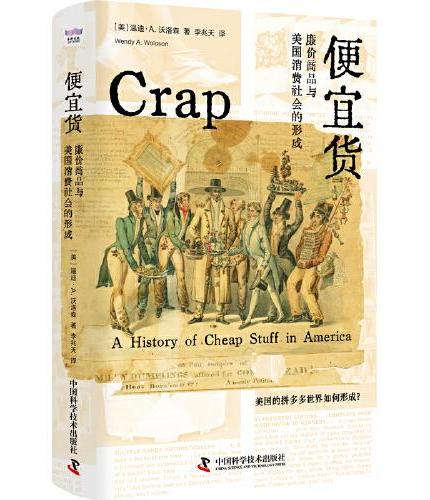
《
便宜货:廉价商品与美国消费社会的形成
》
售價:HK$
77.3
《
读书是一辈子的事(2024年新版)
》
售價:HK$
79.4
《
乐道文库·什么是秦汉史
》
售價:HK$
82.8
內容簡介:
《2013年中国农业发展报告英文版》主要讲述了,Agricultural production. The sown areas of grain crops totaled 106.79 million hectares in 2008, up 1.15 million hectares from the previous year, while total grain output rose by 5.4% to 528.71 million tons, hitting a historical high. 2008 marked the fifth consecutive year that recorded an increase in grain production, for the first time in 40 years. Per-hectare grain output reached 4,951.5 kilograms for the fifth successive year, for the first time since the founding of New China in 1949.
目錄 :
Foreword
ExecutiveSummary
Agricu|turalDevelopmentin
GeneralSituation
CropProduction
AnimalHusbandry
VeterinaryServices
Fishery
TownshipEnterprises
LandReclamation
AgriculturalMechanization
Agro-productPricesandMarket
Agro-productImportsandExports
Farmers''IncomeandConsumption
StateFundsforAgriculture
AgriculturalComprehensiveDevelopment
PovertyAlleviationandDevelopment
FeedIndustry
GrasslandProtectionandConstruction
Figure12ProducerPriceIndicesofFarmProductsandPriceIndicesofMeansofAgriculturProductionfrom1996to
Figure13UsageandPriceIndicesofChemicalFertilizersfrom1996to
Figure14MonthlyRetailPricesofUreain
Figure15UsageandRetailPriceIndicesofPesticidesfrom1996to
Figure16UrbanandRuralConsumerPriceIndicesfrom1996to
Figure17OutlputandImportsofChemicalFertilizersfrom1996to
Figure18Agro-productExportsinProportiontoNationalTotalfrom1996to
Figure19Agro-productImportsinProportiontoNationalTotalfrom1996to
Figure20ImportsandExportsofGrainnotincludingsoybeansfrom1996to
Figure21AveragePerCapitaLivingExpensesofRuralResidentsfrom1996to
Figure22AreasofDisaster-hitFarmland10percentlossormorefrom1996to
Figure23AreasofDisaster-hitFarmland30percentlossormorefrom1996to
Figure24AgriculturalValuesAddedinProportiontoGDPfrom1996to
Figure25ValuesofRuralRetailSalesofConsumerGoodsinProportiontoNationalTotalfrom1996to
Figure26IncomeofUrbanandRuralResidentsfrom1996to
Figure27EngelCoefficientsfrom1996to
Figure28AveragePerCapitaGrainConsumptionbyUrbanandRuralResidentsfrom1996to
Figure29AveragePerCapitaConsumptionofPork,BeefandMuttonbyUrbanandRuralResidentsfrom1996to
Figure30AveragePerCapitaNetIncomeofRuralResidentsin2012byProvinces,AutonomousRegionsandMunicipalities
Columns
Column1TheNationalModernAgricultureDevelopmentPlan2011-2015
Column2NationwideCampaignLedtoNine-YearGrowthSteakofGrainOutput
Column3High-yieldCropProductionin
Column4DevelopmentofDemonstrationFarmsforStandardizedLivestockandPoultryHusbandry
Column5TheNationalMedium-andLong-TermPlanforAnimalDiseaseControl2012-2020
Column6ClaimsforCompensationinPenglai19-3OilSpillAccident
Column7LeisureAgricultureBoomingNationwide
Column8AnOverviewoftheDevelopmentofTropicalAgriculturein
Column9PilotSubsidizationProgramforAgriculturalMachineryScrappingandUpgrading
Columnl0CompensationandRewardingMechanismforGrasslandEcologicalPreservation
Column11ChinaEncouragesDevelopmentofLeadingEnterprisesinAgriculturalIndustrialization
Column12DevelopmentofUrbanModernAgricultureGatheringMomentum
Column13SubsidizationofAgro-processinginProducingAreas
Column14Agro-productMarketingandPromotion
Column15The12316Hotline
Column16SpecialOperationagainst"LeanMeatEssence"
Column17TheNationalPlanforDevelopmentofModernCropSeedIndustry2012-2020
Column18ProtectionofNewAgriculturalPlantVarietiesMakingRemarkableProgress
Column19TheYearofSeed-relatedLawEnforcementProgramin
Column20TheYearofAgro-techPromotionProgram
Column21PromotingTechnologicalServicesforSoilTestingandFormulatedFertilization
Column22PilotProgramforCultivationofNewCareerFarmers
Column23Promotingdevelopmentofwater-savingagriculture
Column24UpgradingandImprovingtheStateFarmManagementSystem
Appendix
Table1StatusofRuralEconomyinNationalEconomy
Table2TotalOutputValueandCompositionofAgriculture,Forestry,AnimalHusbandryandFisheries
Table3MaterialConditionsforAgriculturalProduction
Table4AgriculturalInvestment
Table5AcreageSowntoCrops
Table6NaturalDisastersforAgricultureandFloodandSalinizationControl
Table7OriginalValueofProductiveFixedAssetsPerHouseholdinRuralAreas
Table8BasicConditionsofRuralHouseholds
Table9OutputofMajorFarmProduce
Table10Livestock,PoultryFarmingandAquaculture
Table11MajorFinancialandEconomicEfficiencyIndicesofTownshipEnterprises
Table12RiceSupplyandDemandandPrices
Table13WheatSupplyandDemandandPrices
Table14CornSupplyandDemandandPrices
Table15SoybeansSupplyandDemandandPrices
Table16Output,ImportandExportofGrainandEdiblePlantOil
Table17Output,ImportandExportofCottonandSugar
Table18PorkProduction,Consumption,hnportandExport
Table19Output,ImportandPricesofChemicalFertilizersandPesticides
Table20PerCapitaIncomeofUrbanandRuralResidents
Table21PerCapitaSpendingofUrbanandRuralResidents
Table22PerCapitaFoodConsumptionofUrbanandRuralResidents
Table23PriceIndices
Table24ProducerPriceIndicesofFarmProducts
Table25ClassifiedRetailPriceindicesinUrbanandRuralAreas
Table26WholesalePricesof"VegetableBasket"Products
Table27StateRevenueandExpenditure
Table28RuralLandContractManagement
Table29RuralHouseholdPopulationandLaborForcein
Table30Enterprises,EmploymentandCultivatedLandinAdministrativeVillagesin
Postscript